Energy Consumption
In view of global warming and the structural adjustment of domestic power supply, energy management, energy conservation, and emissions reduction have become popular topics in society and the key issues of enterprises. In addition to pursuing sustainable business, we spare no effort to practice environmental protection to create a better future for the Earth, the environment, and future generations.
At the end of 2016, our Hsinchu Site completed its third-party external verification of ISO 50001 Energy Management System and by extending the EMS promotion experience of the Hsinchu Site to Linkou Site, we were able to have Linkou Site pass its third-party external verification in 2017. We will progressively implement the system across all E Ink sites to demonstrate our determination and efforts to implement energy conservation and emissions reduction. We implemented the Energy Management System version switch in 2018 and completed our ISO 50001:2018 verification as of November 2019.
At E Ink, we implement midstream-downstream vertical integration for integrated production. Our Hsinchu Site was once responsible for the manufacturing of front-end display panels. At the same time, Linkou Site and USA Sites produce e-ink, with the assembly of terminal module products being done at our Yangzhou Site. Therefore, energy management and intensity of product energy consumption at different sites may vary significantly due to the means of energy supply in the production region and the product structure involved.
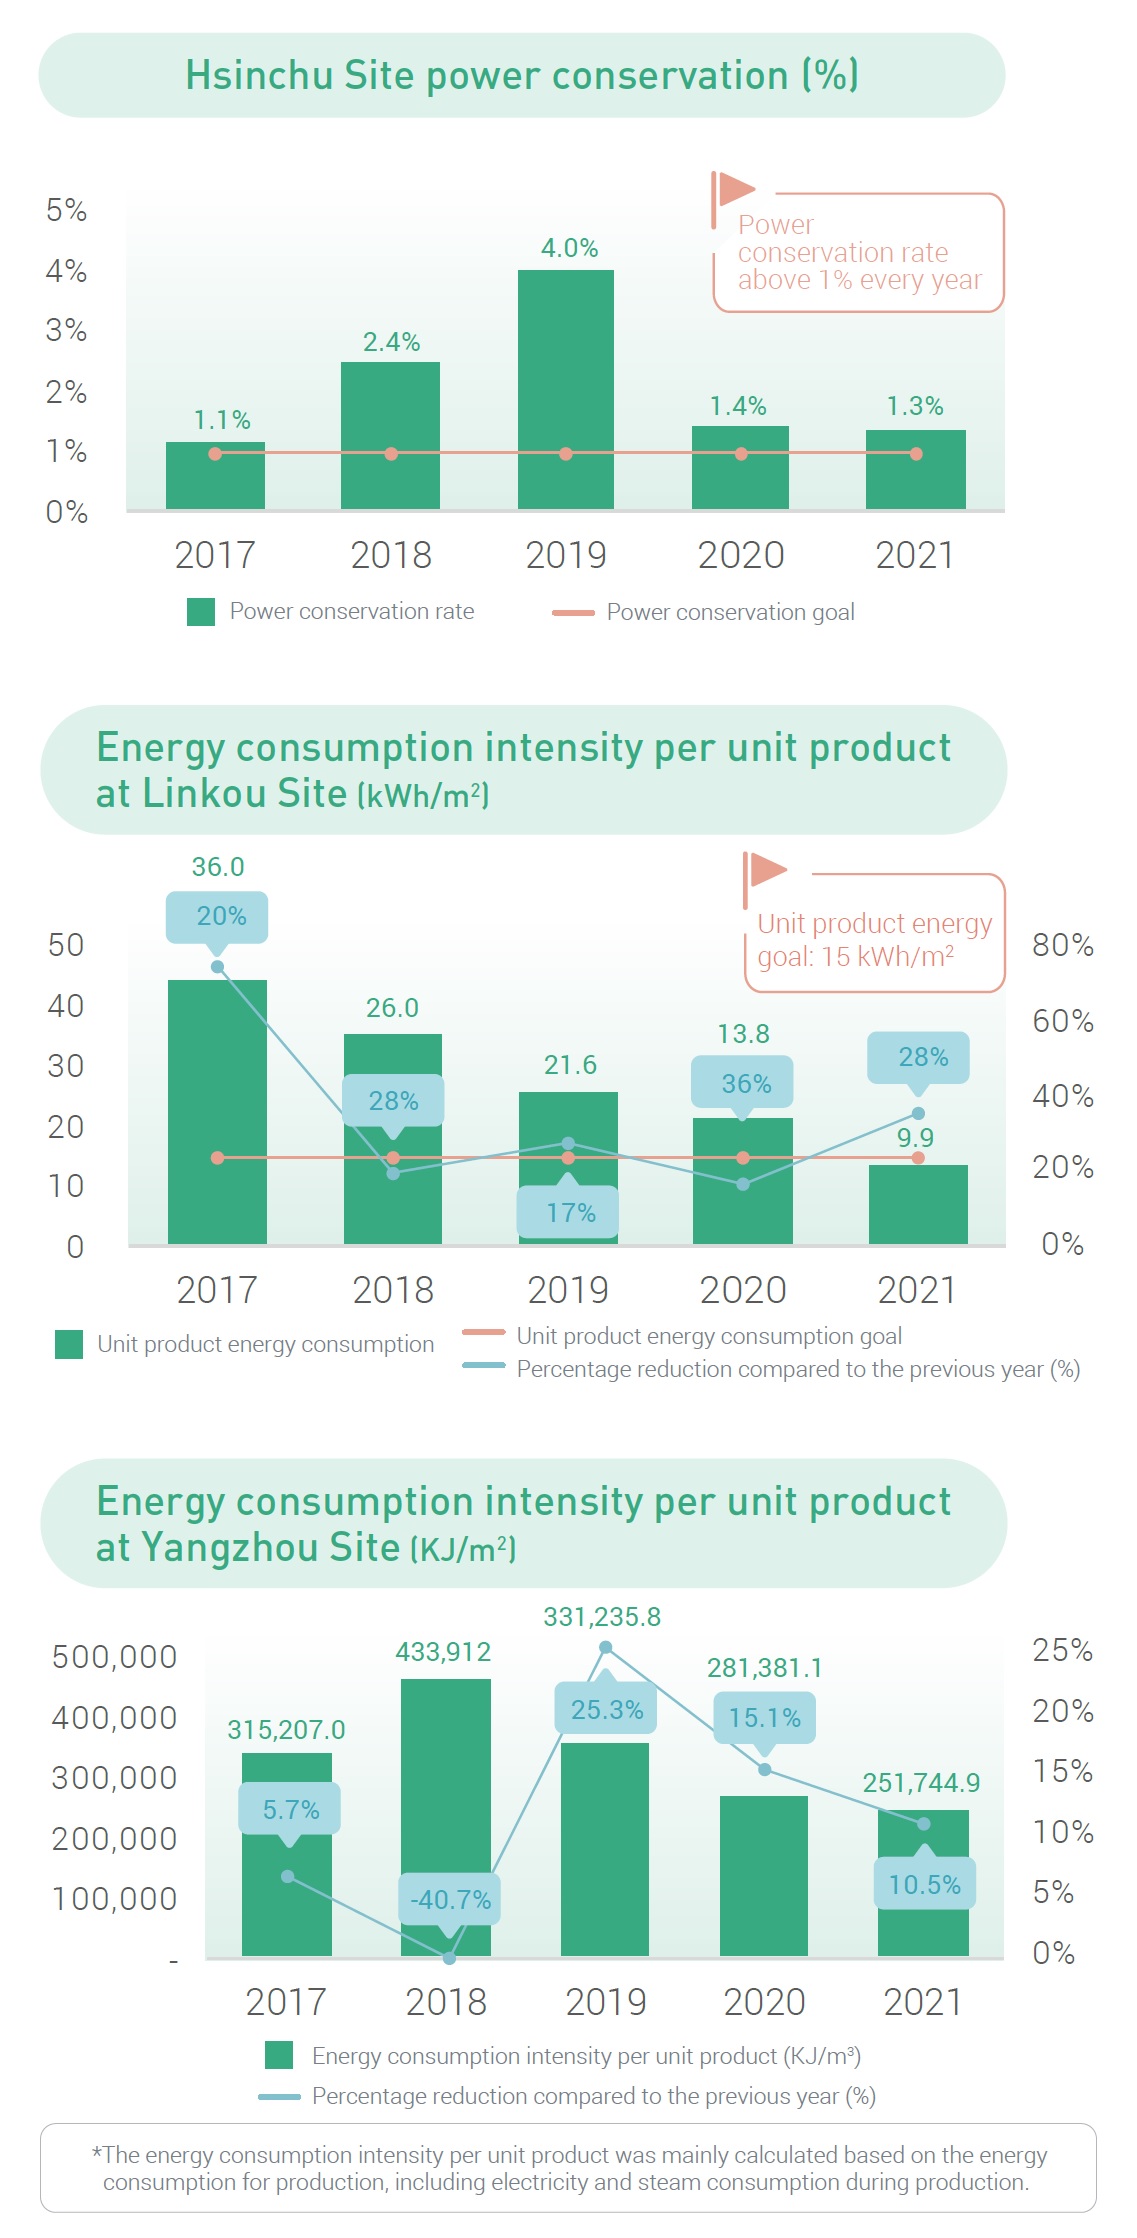
As our Taiwan sites conforms with the government energy policy, Hsinchu Site is currently subject to energy regulation. The average power conservation rate of 1% in 2015~2021 has been set as the overall energy saving objective, while the facilities and production equipment have been gradually adjusted based on the practical needs for better energy conservation in conjunction with our in-house energy-saving program. Consequently, our annual power conservation rate at Hsinchu Site has consistently exceeded 1%.
Furthermore, since Hsinchu Site has transformed to a FPL manufacturing site at the end of 2021, providing data related to environmental goals for the starting year, 2022, and making comparison with the data from other sites is our priority.
For Linkou Site, after achieving the Phase I power saving target of 15kWh/m2 unit product energy consumption, we aim to move on towards the power saving target of Phase II, namely achieving 7.5kWh/m2 by 2025. Despite the increase in production capacity in recent years, Linkou Site has maintained a steady level of power consumption. As such, the energy consumption intensity per unit product of the site has been falling significantly each year. In 2017, Linkou Site entered the phase of mass production with significantly increased production volume and a portion of the energy-saving measures implemented in conjunction. Although the overall power consumption increased, the site's energy consumption and GHG emission intensity per unit product fell noticeably.
A new model of mass production was introduced at the site between 2018~2021, with production capacity continuing to grow. At the trade-off of the modest increase in overall power consumption, Linkou Site's energy consumption and GHG emission intensity per unit product continued to fall. This reflects our success in the area of energy management promotion.
As far as Yangzhou Site is concerned, due to the multiple energy-saving that were implemented simultaneously with increased production capacity in 2015, the intensity of electricity consumption of the Yangzhou Site fell significantly compared to 2014 and has been steadily reducing after that. Nevertheless, Yangzhou Site's power consumption grew slightly in 2018 due to capacity transfer as a result of site relocation, and yet production capacity has dipped slightly due to the reduced utilization rate.
Consequently, the site's energy consumption and GHG emission intensity of product increased slightly. In 2019, all machinery and facilities were properly installed for operation, and the site's capacity has been restored to a normal production schedule with adequate manpower in place. As expected, the site's product unit energy consumption promptly returned to the level of previous years. During 2020~2021, we have been able to achieve our given targets in terms of the overall production volume for the year, while the power consumption at our HQ and sites have fallen steadily. This reflects our notable success in reducing unit product power consumption.
The aforementioned GHG emission intensity of product was calculated based on the total volume of Scope 1 and 2 emissions divided by our overall production capacity.
