E Ink Actions|E Ink ESG Website

Waste Management
Resource Recycling

Waste Management

E Ink is committed to achieving environmental sustainability goals by setting circular resource management targets aimed at increasing waste recycling rates and improving the efficiency of raw material use, thereby reducing resource consumption.


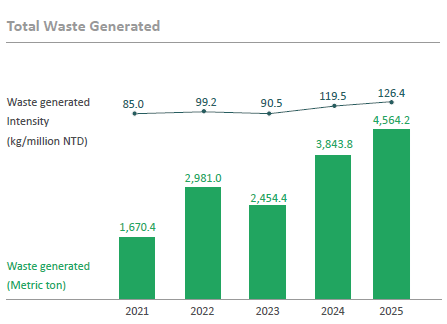
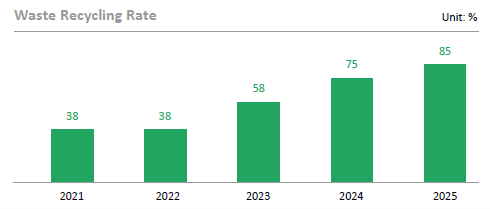
In 2025, E Ink's global manufacturing sites generated a total of 4,564.2 metric tons of waste, representing a 19% increase compared with 2024. The overall recycling rate increased from 75% in 2024 to 85% in 2025. Among the manufacturing sites, the recycling rate at the Taiwan sites increased by 12% compared with 2024, while the Yangzhou site and the US sites each increased by 2%.

Resource Circularity Management

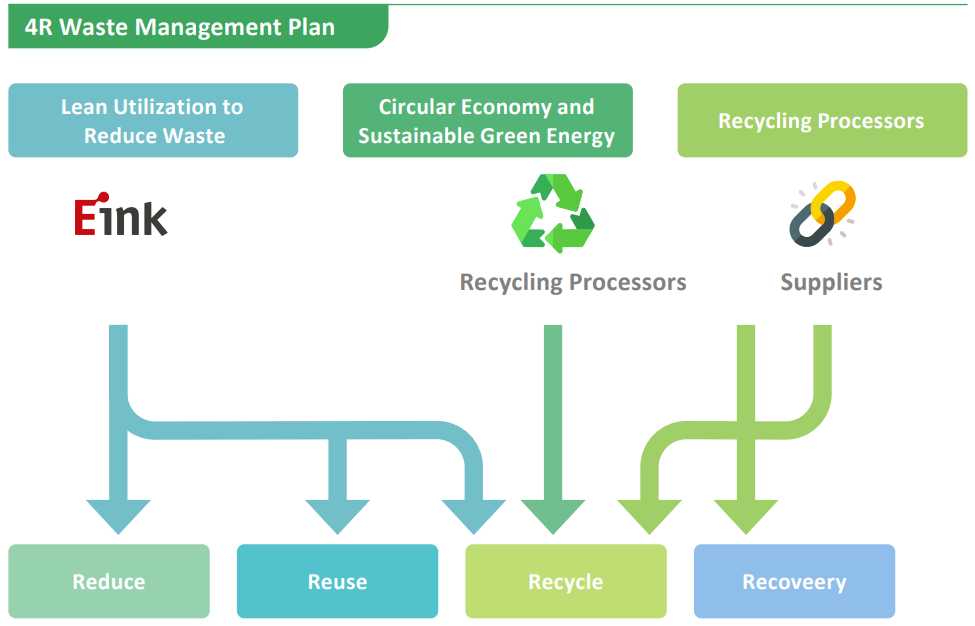
To reduce the overall waste generation and the proportion of waste treated by incineration and thermal recovery, E Ink collaborates with suppliers and recycling processors to jointly promote the 4R waste management plan (Reduce, Reuse, Recycle, Recovery). By formulating strategies such as lean utilization to reduce waste, circular economy and sustainable green energy, and proper disposal through recycling, the Company prioritizes converting waste that would otherwise be treated by thermal recovery and landfill, achieving waste reduction and management goals.


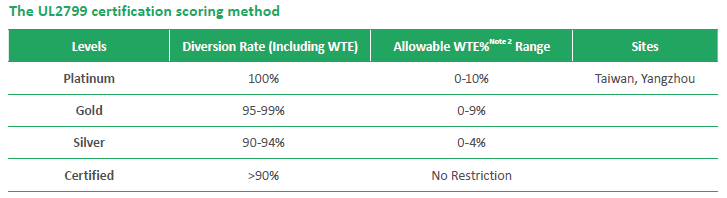
As global attention on environmental protection and sustainable development continues to grow, how businesses effectively manage resources and reduce waste has become a key issue. To address this, E Ink has been promoting the UL2799 Zero Waste to Landfill Validation since 2019, aiming to increase the proportion of waste recycled, reused, or converted, and to avoid landfill disposal or incineration without energy recovery, in pursuit of a zero-waste goal.


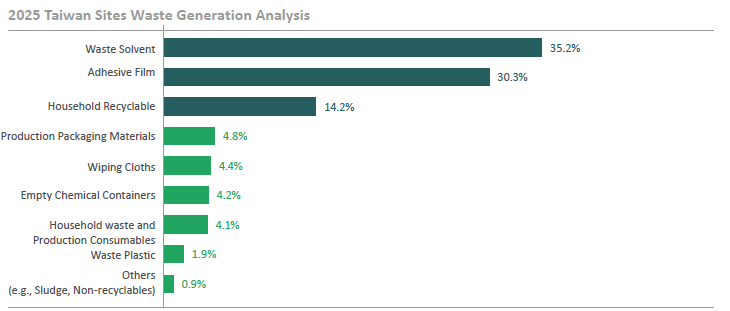
E Ink's primary sources of waste include waste solvents, adhesive plastic film, household recyclable materials, and production packaging materials, which account for over 80% of the total waste by weight. In the past, this waste was primarily handled through incineration, a process that produces a large amount of carbon dioxide and adds additional environmental burden. To reduce carbon emissions and improve resource utilization efficiency, E Ink has strengthened its waste management measures starting in 2024, improving sorting operations and actively promoting waste recycling and reuse to establish a more sustainable waste treatment model.
In 2025, E Ink's Taiwan and Yangzhou sites achieved a 100% waste diversion rate Note 1 and obtained the UL2799 Platinum Certification, the highest level under the standard. This ensures that all waste is managed through recycling or reuse, with no waste sent to landfill or incineration without energy recovery. These achievements demonstrate E Ink's strong commitment and progress in advancing the circular economy and sustainable development.

Note 1: Waste diversion rate = (reuse + reduction + recycling + reutilization + waste-to-energy recovery + anaerobic digestion + biofuels + composting) / total weight of generated waste.

Note 2: Waste to Energy (WTE) refers to the process of converting waste into usable energy.


The Taiwan and Yangzhou sites have achieved the highest UL 2799 Platinum rating standard

Lean Utilization to Reduce Waste

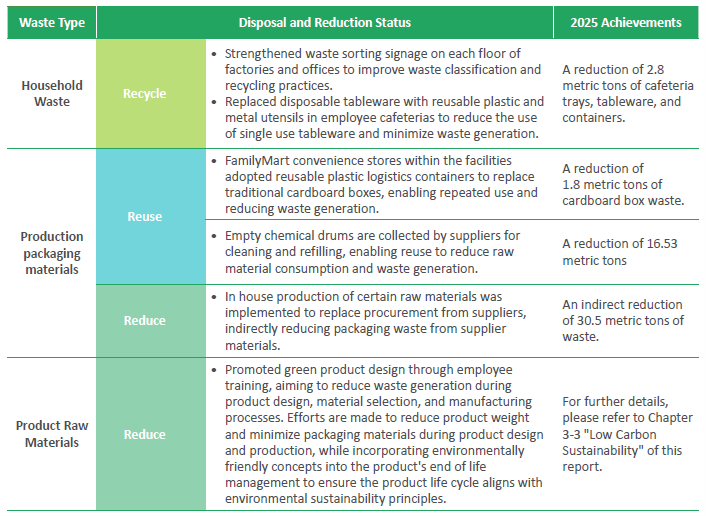
E Ink strictly adheres to the regulations related to waste management and is committed to minimizing environmental impact. The Company prioritizes raw material reduction, followed by reuse and recycle. Through waste management analysis, E Ink’s Taiwan sites focus on waste reduction, particularly in household waste, production of packaging materials, and product raw materials.

Circular Economy and Sustainable Green Energy

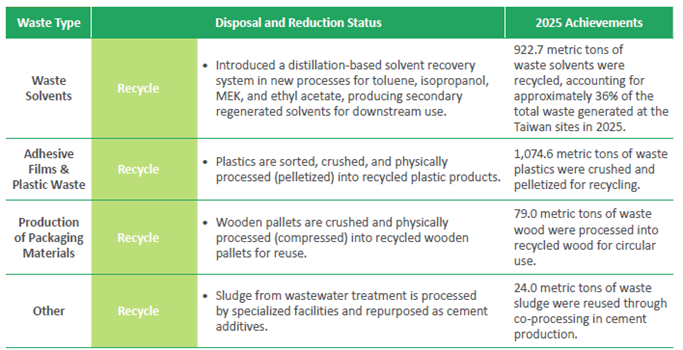
E Ink collaborates with recycling processors to regenerate waste solvents, adhesive films, and plastic waste into new products, ensuring efficient waste circularity.

Treatment of Disposal and Recycling

In addition to implementing plastic reuse and classification management within the facility, E Ink ensures that some resources can be used as packaging, transportation, or production auxiliary materials during the manufacturing process, maintaining the potential for reuse. In 2025, E Ink continued to actively establish partnerships with suppliers, requiring the reuse of raw material packaging materials to reduce resource waste and increase the reuse rate of waste and resources. For waste that cannot be reused within the sites or by suppliers, it is stored and prioritized for energy recovery through incineration. Waste that cannot be incinerated is ultimately disposed of through landfill.

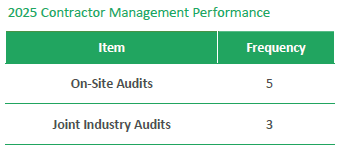
Furthermore, E Ink implements strict supervision of external units responsible for waste removal and treatment. Regular audits of partnered waste removal and treatment companies are conducted to ensure they comply with regulations and meet E Ink's expectations and standards. Since 2018, E Ink has been working in collaboration with the Allied Association for Science Park Industries and the Taiwan Panel & Solution Association (TPSA) to conduct joint third-party audits of waste removal and treatment companies, in order to further ensure operational compliance and enhance treatment standards. By accompanying inspections, on-site audits and joint industry audits, E Ink conducts comprehensive assessments of contractors in areas such as safety, hygiene, environmental protection, and fire safety. This ensures that partnerships are established with high-standard companies, safeguarding the quality and compliance of the waste treatment process. 

Product Recycling, Reuse, and Circularity

In order to continuously improve customer service satisfaction and increase product reuse, E Ink provides return and repair services for ePaper module products sold. In 2025, the total weight of Return Material Authorization (RMA) products at E Ink was 14.2 metric tons, and the product reuse rate after repair reached 24.9%. The RMA or take-back program did not create financial benefit since it generated costs. Furthermore, E Ink will continue to research relevant technical processes and further overcome product repair technology bottlenecks to increase RMA reuse rate.


Category 2021 2022 2023 2024 2025
Total weight of the product from RMA (metric tons) 3.1 4.8 8.6 8.5 14.2
Percentage of the product sold each year that could be reused or recycled from RMA (%) 100 100 100 100 100
Percentage of the product from RMA that were actually reused/resold/recycled (%) 54.0 54.7 41.5 30.6 24.9
Percentage of the product from RMA that were disposed/landfilled (%) 46.0 45.3 58.5 69.4 75.1